Are you monitoring your battery impedance based on initial or average measurements? If your answer is the latter, you may be putting your battery performance at risk when it’s needed the most – during a power failure. This presentation explores a case where a company was using average impedance values to determine when to service their batteries – and what went wrong!
In this case, the battery system has faced many early stage battery failures – possibly due to manufacturing defects or handling abuses during transport and installation. As the result of these battery replacements and the service company utilizing the current average impedance value as the baseline for determining the health of the batteries, the alarm thresholds (maintenance and failure) were constantly changing. This resulted in confusing results on which battery units needed attention. Had the initial impedance value for each battery unit been used as the baseline for determining the state of health of the battery, a more accurate and less confusing determination of which battery units needed replacement would have been achieved. And, this backup power system could have performed as designed during the blackout.
Additionally, this situation is further intensified by the fact that this system utilized 12V battery units. The impedance value for the 12V battery unit is the sum of the six 2V cells that make up the battery unit. As is pointed out in the video, the failure of one of the six 2V cells can be masked by the other cells – leading to a smaller change in the impedance for the whole battery unit as the individual cell degrades. Combine this effect with the current average of impedances as the method for setting the baseline for alarm thresholds and you have a recipe for disaster. This “average of sums” scenario makes it very difficult to identify failing battery units.
BTECH recommends using the initial impedance value of each battery unit as the baseline to assess the capacity of the battery to perform – especially in the case of 12V and 16V battery units.
Transcript:
The battery was originally installed in NY City sometime in 2001. It was a UPS Application. There were two strings of 40 12V Units. The building had no generator, so when we calculated the runtime out it should’ve done 90+ minutes of runtime. The battery monitor was actually installed in early 2002 and was monitored by the vendor, BTECH in this case. A number of the battery units had already been replaced in 2003 because they were having problems. It took almost 6 months to get this monitor up and running to a point that we were happy with. Our story starts in July of 2003.
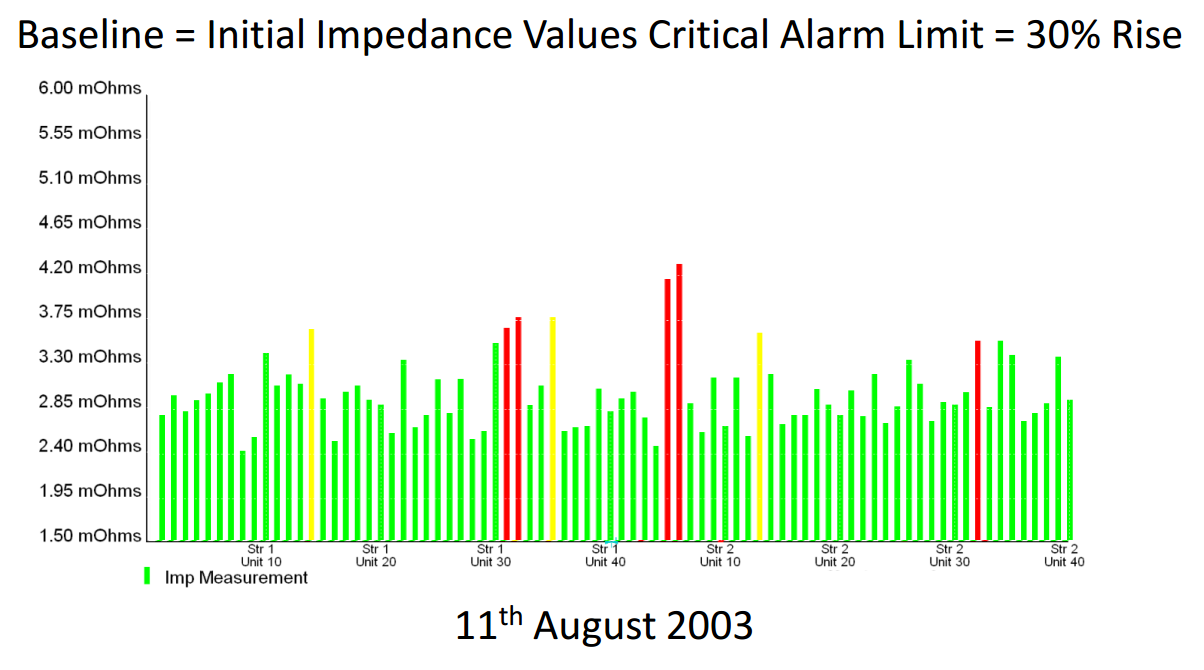
This is the readings of the battery in July of 2003 based on the initial impedance values with a critical alarm limit of 30%. So in other words this was set up, at that point C&D had already put in a document that said ‘A 30% rise in what we value is eventually a 20% loss of capacity’. However, the actual service company was not using initial values, they were simply using the average at each reading as a way of measuring – I say the average of each reading in this case because a lot of times they don’t even use the original average, which would make some sense, but they don’t use the original initial average. As you can see, with this one, there are not only three in the alarm condition but they did agree to change them – so they changed them out and on the next reading, you now have two. But didn’t we just change the three out? We just discovered the first problem with trying to use an average value as the basis – if you’ve got high impedances on a number of units it will bring the average up. So what happens then is when you replace the high impedance units you actually bring more units into play and establish the fact that they’re now above the alarm limit.
On the 11th of August we basically had five units in alarm and three of them in maintenance alarms, based on the 30% rise. Then we had a power failure, I think most of you are old enough to remember it. ‘Major Power outage hits New York, other large cities’. So what happened to our UPS? Let’s have a look at it.
At 22:49 the power failed, you can see, slow but sure, the voltage dropped, the current was dropping off, there was a step there for some reason the current drops and at 23:25 the UPS disconnected. I said it was 90 minutes, this thing only actually ran for 35 minutes. Now, it was cut off – it was slightly above the cutoff point at which it stopped, but it was nowhere near running for 90 minutes. Not only that, there were fifteen units that were below the alarm limits, but we only identified eight. What happened?
Well, the first eighth of the graph are units we identified as being above limits, so that’s the eight units that were on the original graph. The blue is the actual run time, and this line here is an indication of what the impedance value was above the limit. So, as you see there is a certain element of correlation between those ones we identified and the actual runtime – it’s not perfect, but there is a correlation i.e. the higher the impedance, the lower the runtime. But what happened to the other ones that we see?
Again, we have the line that’s your runtime dropping off here but the run time does not correlate at all. So we have a problem, the question is what is the problem? Okay so let’s have a look at the ones that didn’t correlate to impedance. String 1 Unit 30, what you’ll see is you have a unit that drops off, stabilizes slightly, drops off again, and comes down. Very clearly what happened is we were actually losing units within that block, cause these are 12 volt blocks, so if you actually lose an individual cell, it will drop off the power available at that voltage. What’s more interesting is, if we actually look at the behavior of this unit after the discharge you’ll notice that it was actually trending upwards, it just hadn’t reached the alarm point yet, but it was trending upwards. There’s the blackout, it went into maintenance and then rose to critical. Now, that last point here in fact is when the old battery was changed out in December, they changed the whole battery out in December so you’ll see this throughout, but that was what happened, and that one failed almost immediately.
The next unit – similar behavior, a little bit more dramatic, really dropped down again and again and again – it just failed. In this case, when we look at the actual impedance data following it, it went into the critical mode almost immediately. It was clear that during the discharge, whatever was wrong with that battery actually was made worse by the actual discharge, so that was very clear there.
This one’s very interesting, because what you’ll see here is that it came down forward very well and then dropped off and then started to drop again. We don’t know because we didn’t actually get the chance to take any of these batteries apart and analyze them which is a key element to really finding out what’s happening. But the whole point with this is, my guess is that having watched it is that this is a battery that was actually starting to dry out because this is a typical discharge characteristic of a battery that has started to dry out. What you’re getting is that it will discharge correctly all the way down and then at one point it effectively runs out of active material. There simply is no more active electrolyte to conduct so it dries out. So, if I look at what happened afterwards, it slowly started to rise and actually went into alarm at the very last moment. That would again tie it, what happened was because of the discharge it would’ve dried out even more and then it would continue to dry out. It might well be that the whole act of doing the discharge or the recharge part caused – if we had a valve that was sticking just the act of recharging would cause that valve to open a little bit more and continue to cause the battery to dry out.
This is a really interesting one, because you can see it clearly dropped off, then it stabilized, and then it continued to decline. So, in fact, it continued to give power just at a lower level, it looks that one of the cells may well have gone in reverse, simply lack of capacity. What’s more interesting is, when you actually look at it, if you’ll notice the impedance actually started to drop off after the blackout. So it may well be that that cell in there has a partial short in it, and that’s what’s causing the impedance and it’s probably shorting even more as the impedance is dropping down. That would explain why you’re not getting a rise in impedance and it fell off the point.
The whole point of this is to look at the ones that didn’t show up on the impedance, and there’s a reason for all of them. The question is why did these units that failed not show a rise in impedance? Well let’s look at this – what you can have is you have a battery here, the moment that one cell fails, simple as that, that’s what’s happening. Just because only one cell failed within a six cell module, you’ve actually lost that unit for capacity within the discharge.
The next example’s going to show you what happens, this is what I’m going to show you here, this is actually four 2 volt blocks that happened to be side by side in a large battery. They are VRLA 2 volt units, this over a 29 month period. If you actually add the four together you end up with a combined rise in impedance over the 29 months of 23%, so that’s nowhere near any of the limits near the 30% limit, you can still say that the four unit block is working correctly. Unit 75 actually only rose by 5%, unit 74 by 11%, unit 73 by 34%, and unit 72 was actually up at 54%. So it’s easy to see and understand based on this how you can have one cell within the 12 volt unit that’s well past its limits, is already actually indicating failure, that you can measure it and find if it failed. The problem that we have is, that even with some of the customers that have multi-cell blocks insist on measuring them at the jar level, not at the individual cell level. This is the mistake they’re making, because they’re not identifying the potential failures within each of the cells. You have to if you’re going to design, if you’re going to sell a battery monitoring system you have to look at it from that point of view.
For further information on this or anything else, please contact sales@btechinc.com or call. Thank you.